Tavex uses cookies to improve your user experience. By continuing to use our site without changing your settings, you agree to receive cookies from Tavex’s website. Read more about our cookie policy
Please select what cookies you allow us to use
Cookies are small files of letters and digits downloaded and saved on your computer or another device (for instance, a mobile phone, a tablet) and saved in your browser while you visit a website. They can be used to track the pages you visit on the website, save the information you enter or remember your preferences such as language settings as long as you’re browsing the website.
Cookie usage
Necessary
| Cookie name | Cookie description | Cookie duration |
|---|---|---|
| tavex_cookie_consent | Stores cookie consent options selected | 60 weeks |
| tavex_customer | Tavex customer ID | 30 days |
| wp-wpml_current_language | Stores selected language | 1 day |
| AWSALB | AWS ALB sticky session cookie | 6 days |
| AWSALBCORS | AWS ALB sticky session cookie | 6 days |
| NO_CACHE | Used to disable page caching | 1 day |
| PHPSESSID | Identifier for PHP session | Session |
| latest_news | Helps to keep notifications relevant by storing the latest news shown | 29 days |
| latest_news_flash | Helps to keep notifications relevant by storing the latest news shown | 29 days |
| tavex_recently_viewed_products | List of recently viewed products | 1 day |
| tavex_compare_amount | Number of items in product comparison view | 1 day |
Preference
| Cookie name | Cookie description | Cookie duration |
|---|---|---|
| chart-widget-tab-*-*-* | Remembers last chart options (i.e currency, time period, etc) | 29 days |
| archive_layout | Stores selected product layout on category pages | 1 day |
Marketing
| Cookie name | Cookie description | Cookie duration |
|---|---|---|
| cartstack.com-* | Used for tracking abandoned shopping carts | 1 year |
| _omappvp | Used by OptinMonster for determining new vs. returning visitors. Expires in 11 years | 11 years |
| _omappvs | Used by OptinMonster for determining when a new visitor becomes a returning visitor | Session |
| om* | Used by OptinMonster to track interactions with campaigns | Persistent |
Statistic
| Cookie name | Cookie description | Cookie duration |
|---|---|---|
| _ga | Used to distinguish users | 2 years |
| _gid | Used to distinguish users | 24 hours |
| _ga_* | Used to persist session state | 2 years |
| _gac_* | Contains campaign related information | 90 days |
| _gat_gtag_* | Used to throttle request rate | 1 minute |
| _fbc | Facebook advertisement cookie | 2 years |
| _fbp | Facebook cookie for distinguishing unique users | 2 years |

Silver Price Outlook 2025–2026: Is the Next All-Time High Just the Beginning?
Published by Karl Martin Karus in category Articles on 30.12.2025
Gold price (XAU-SEK)
40188,00 SEK/oz
+ 272,20 SEK
Silver price (XAG-SEK)
534,82 SEK/oz
+ 4,33 SEK

Innehållsförteckning / Table of Contents
Silver has entered a phase that few market participants expected to develop so quickly. After breaking decisively above its previous all-time highs, the metal has moved into price discovery — a stage where old resistance levels no longer provide meaningful guidance.
In late December 2025, silver traded above $75 per ounce and briefly moved past $80, while gold climbed at the same time above $4,500 per ounce. These sharp moves have brought an important question back into focus for investors and industry users alike:
Is silver approaching a cyclical peak, or are we only at the beginning of a much larger move?
This article builds on an analysis Tavex shared publicly on Reddit nearly two weeks ago, when silver was trading just below $66 per ounce. Since then, the market has evolved rapidly. By combining recent developments with broader macroeconomic trends and an updated Fibonacci-based technical analysis, this article explores where silver’s next all-time high could realistically form if current conditions continue.
What Changed: Silver Breaks Out Into Price Discovery

For more than a decade, silver struggled to hold above its previous highs. Each rally eventually faded. This time, the situation looks different.
The latest breakout has been supported by broad market participation, a more favorable macro environment for hard assets, and strong industrial demand that cannot be switched off overnight. Together, these factors suggest that silver has entered a new phase.
The breakout matters for three reasons:
- Silver moved decisively above long-term resistance, attracting systematic, momentum-driven, and trend-following investors.
- Gold’s simultaneous strength confirms that this is not an isolated move, but part of a wider repricing across precious metals.
- Both investment demand and industrial consumption are rising at the same time, tightening the physical silver market and increasing pressure on supply.
Macro Drivers Behind the Silver Surge
1) Monetary Policy and US Dollar Dynamics
One of the main forces behind silver’s recent rally is the growing belief that the global monetary environment is changing. When confidence in fiat currencies weakens, investors tend to move toward scarce, tangible assets.
Silver often responds more sharply than gold in these periods. The market is smaller, more volatile, and historically under-owned, which means capital inflows can have a faster and more pronounced impact on price.
2) Industrial Demand Shock Meets Supply Constraints
Unlike gold, silver is not just held — it is used. Demand continues to grow across key sectors such as solar energy, electrification, electric vehicles, and advanced electronics.
At the same time, global mine supply is slow to respond. New projects take years to develop, and production cannot be increased quickly. This creates a structural imbalance where demand is rising faster than supply can adjust, supporting higher prices over time.
3) Geopolitics and Strategic-Metal Repricing
As global trade becomes more fragmented, materials with real-world industrial importance are increasingly valued for their availability, not just their cost. Silver is now more frequently discussed as a strategic input for manufacturing and energy transition infrastructure.
In such an environment, markets may assign a higher premium to metals that are both essential and difficult to replace — a dynamic that can reshape long-term pricing.

Read also:What is silver used for? Guide written by an expert | Tavex
Why Pullbacks After $80 Are Not Automatically Bearish
After breaching $80/oz, silver retraced as traders took profits. In strong trending markets, this is typical. From a market-structure perspective, post-breakout consolidation often helps establish new support zones and improves the durability of the trend — provided higher lows are maintained.
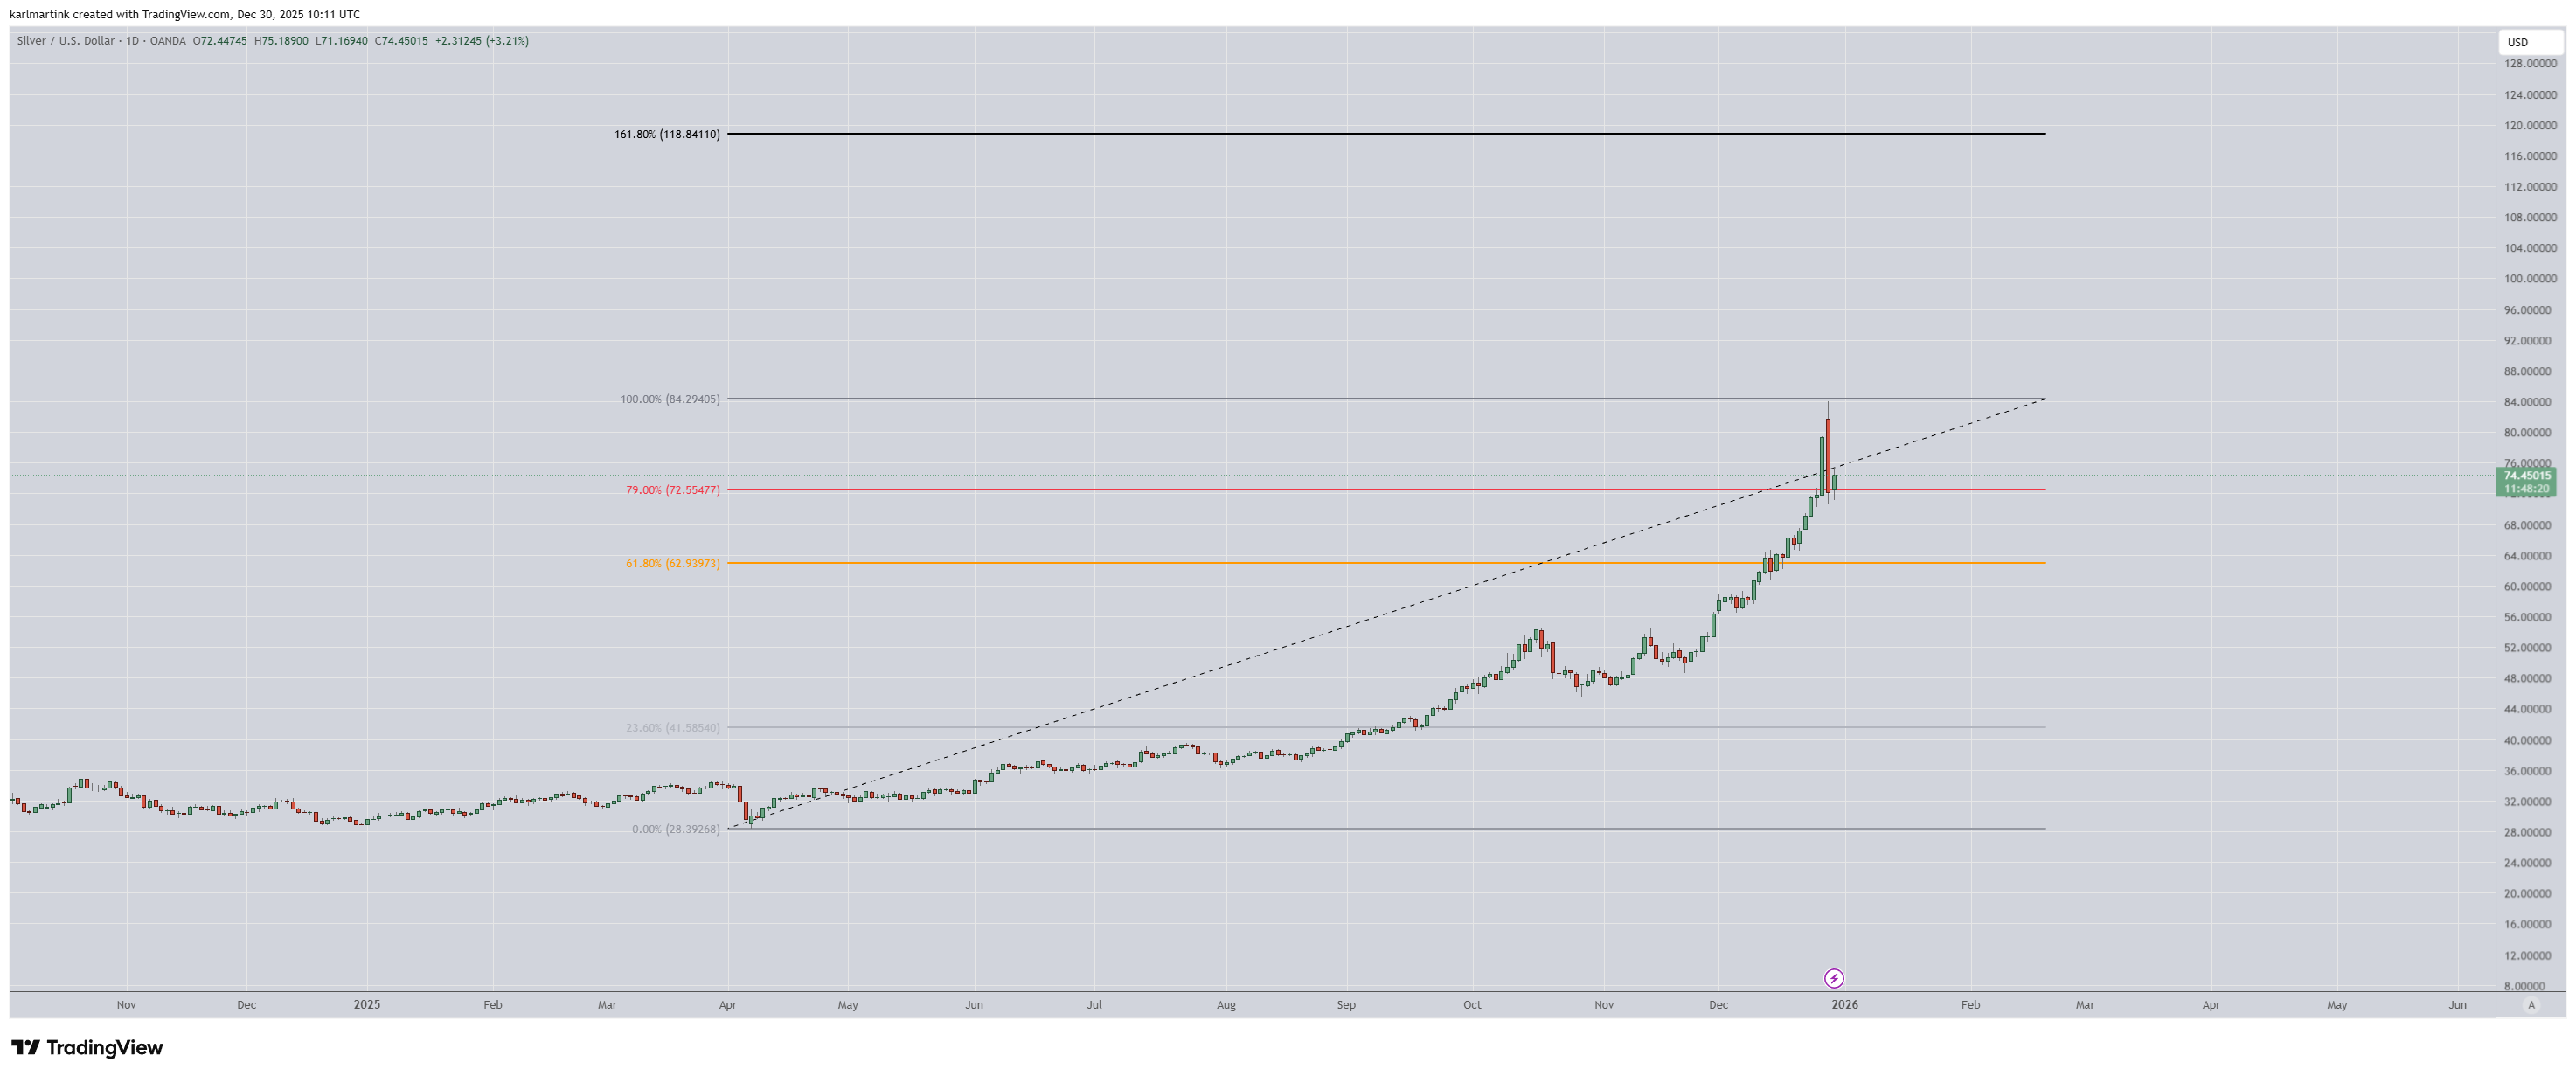
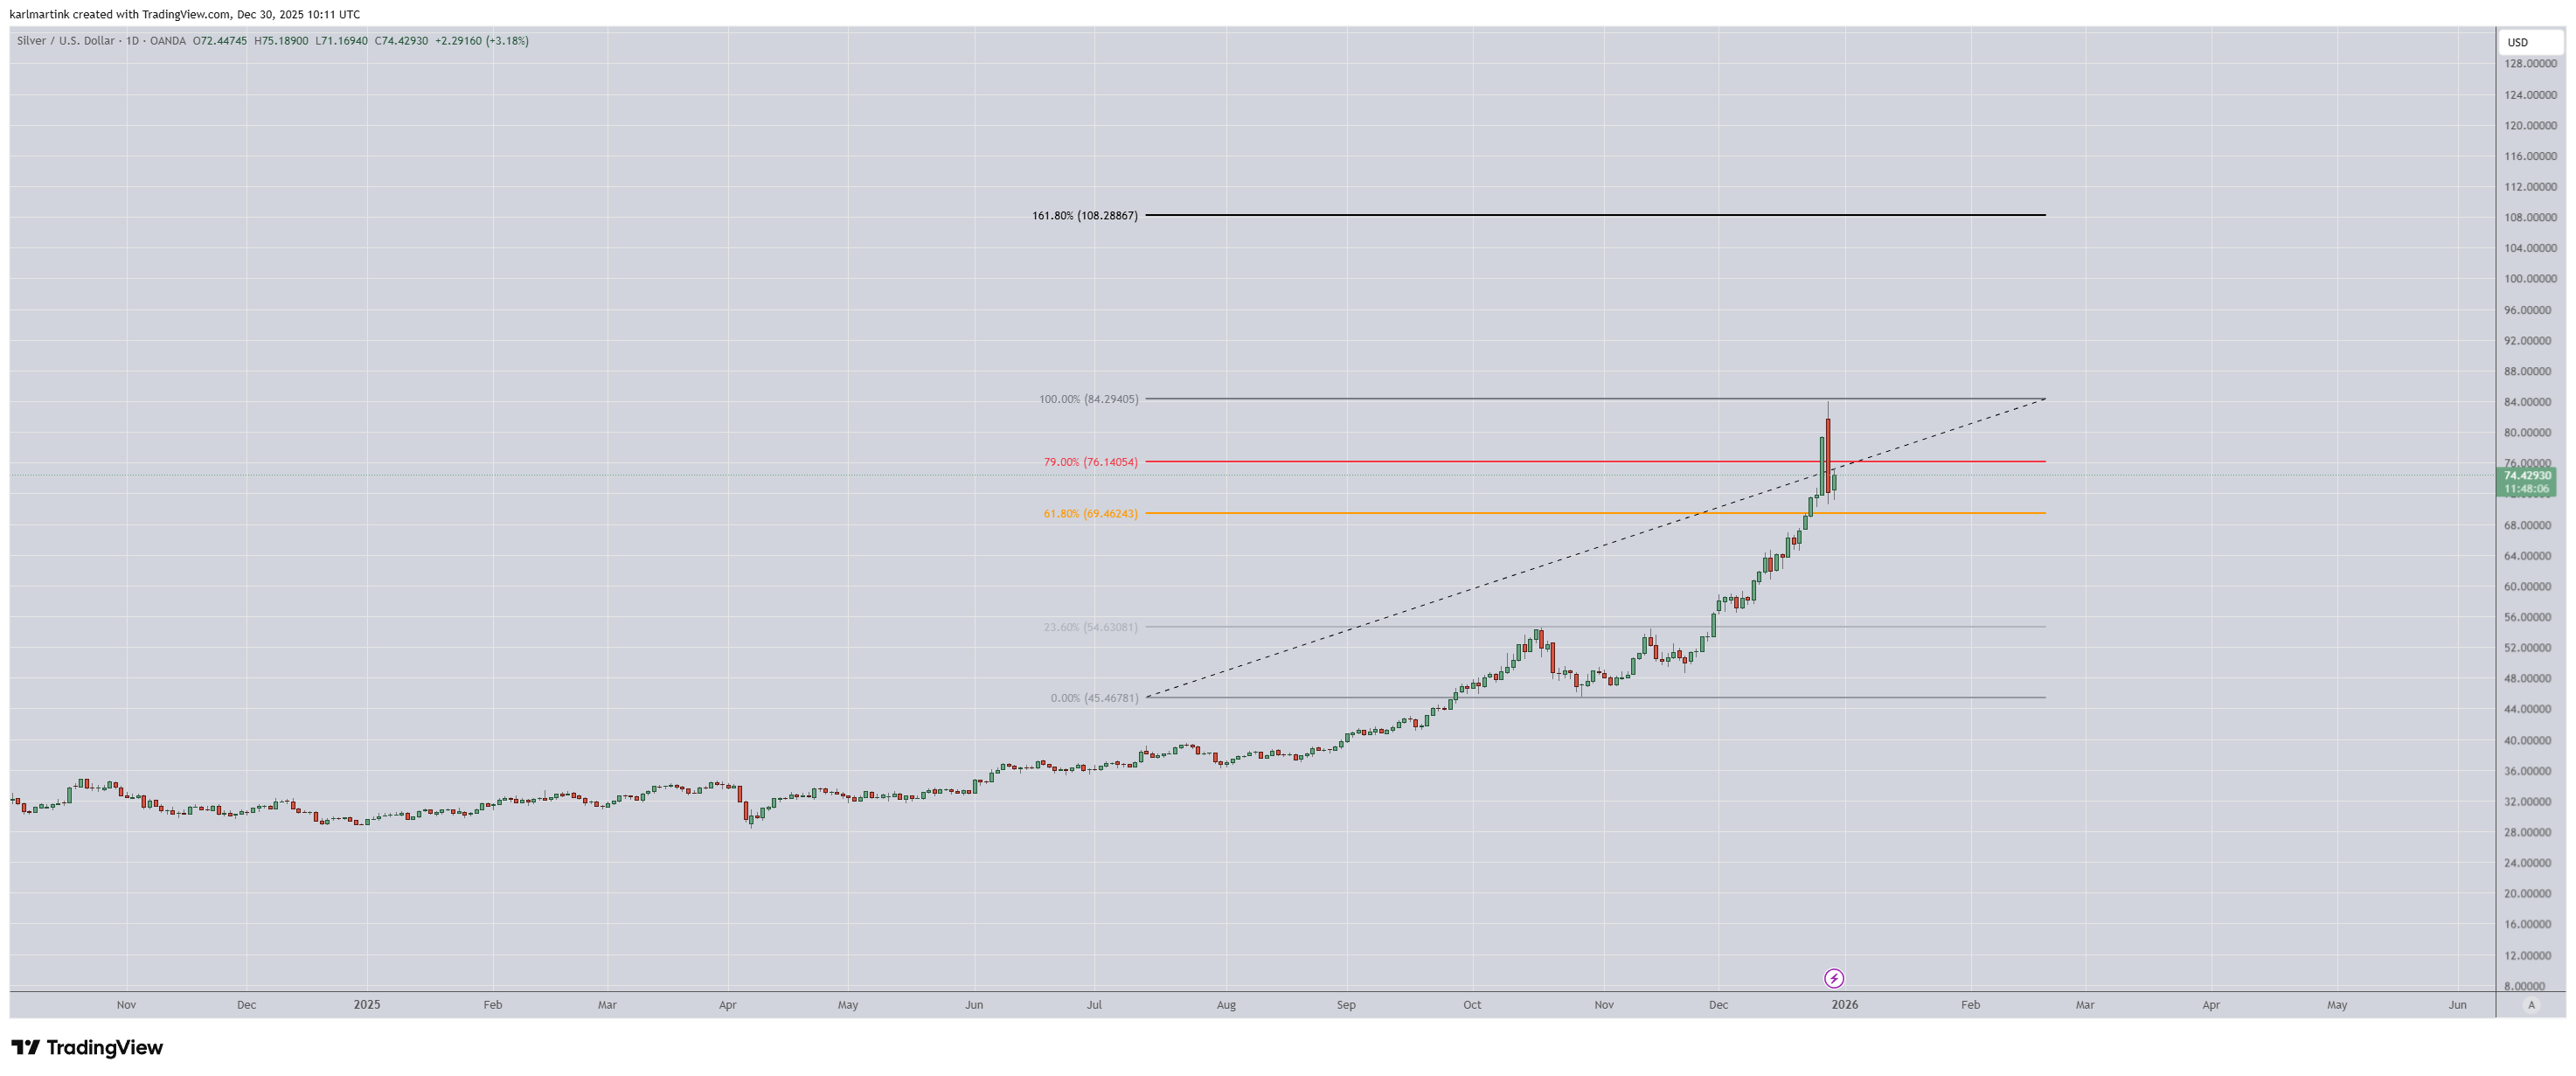
Updated Fibonacci Analysis: Mapping the Next Potential All-Time High
Your original Reddit thesis used Fibonacci extensions to estimate upside potential. With the late-December 2025 breakout now established, the same framework can be updated using the latest swing structure.
Method (high level)
The extension framework is applied from a long-term cycle low to the recent breakout impulse high (the move that carried silver above $80). This produces extension levels that frequently act as trend targets during sustained bull phases.
Key extension zones to watch
- 1.272 extension: commonly reached in early acceleration phases; often becomes a “pause zone”.
- 1.414 extension: continuation target in strong but orderly trends.
- 1.618 extension: the classic “golden ratio” extension; often appears in late acceleration or euphoric phases.
Given current volatility and the magnitude of the breakout, the 1.618 extension scenario places silver in the $105–$115/oz region as a plausible next-cycle target zone — not a guarantee, but a technically derived reference point if macro conditions remain supportive and the trend structure is preserved.
Important: Fibonacci levels are not forecasts. They are *conditional targets* that become more relevant when price remains above key supports and the broader market continues to reward risk in hard assets.
Gold vs Silver: Why Silver Often Outperforms Late in a Precious-Metals Cycle
Historically, gold tends to lead in the early phase of a precious-metals bull market, while silver often accelerates later once investor attention expands. With gold already at record levels, silver’s move can be understood as a catch-up plus leverage effect.
Silver, Bitcoin, and the Hard-Asset Rotation Narrative
Some commentary has framed the move as part of a broader “hard-asset” rotation where investors diversify across precious metals and digital assets. Regardless of preference, the shared driver is similar: concerns about currency debasement and systemic risk.
Key Risks and What Would Invalidate the Bullish Scenario
The main risks to the thesis include:
- A sharp and sustained return to restrictive monetary policy.
- A deep global recession that meaningfully reduces industrial silver consumption.
- Technological substitution that lowers silver intensity in key applications (especially solar).
- Regulatory intervention or market-structure disruptions (margin changes, trading limits, etc.).

Conclusion: The Next All-Time High Could Be Meaningfully Higher
Silver’s breakout above prior highs represents a structural shift, not merely a short-lived spike. When macro tailwinds, industrial demand, and supply constraints align with a bullish technical structure, the market can remain in price discovery longer than most participants expect.
If the trend persists and the macro backdrop stays constructive, the updated Fibonacci framework supports a next-cycle target zone around $105–$115/oz. Expect volatility, but treat pullbacks as part of the process — unless the market breaks key supports and the macro regime meaningfully tightens.
Disclaimer: This article is for informational purposes only and is not intended as an investment analysis or recommendation to sell or buy commodities. Tavex is not responsible for any decisions made based on this information. Investing is associated with opportunities and risks, and the market value of commodities can both increase and decrease. Past or future yields on the commodities and financial ratios shown above do not represent a promise or an indication of future earnings.
Gold price (XAU-SEK)
40188,00 SEK/oz
+ 272,20 SEK
Silver price (XAG-SEK)
534,82 SEK/oz
+ 4,33 SEK
Recommended articles


You might also like to read


Contact
Tavex AB Reg.nr.: 556671-1189 Smålandsgatan 9, 111 46 Stockholm, Sweden
E-mail: tavex@tavex.se
Tel. 08-678 20 30
Comments