Tavex uses cookies to improve your user experience. By continuing to use our site without changing your settings, you agree to receive cookies from Tavex’s website. Read more about our cookie policy
Please select what cookies you allow us to use
Cookies are small files of letters and digits downloaded and saved on your computer or another device (for instance, a mobile phone, a tablet) and saved in your browser while you visit a website. They can be used to track the pages you visit on the website, save the information you enter or remember your preferences such as language settings as long as you’re browsing the website.
Cookie usage
Necessary
| Cookie name | Cookie description | Cookie duration |
|---|---|---|
| tavex_cookie_consent | Stores cookie consent options selected | 60 weeks |
| tavex_customer | Tavex customer ID | 30 days |
| wp-wpml_current_language | Stores selected language | 1 day |
| AWSALB | AWS ALB sticky session cookie | 6 days |
| AWSALBCORS | AWS ALB sticky session cookie | 6 days |
| NO_CACHE | Used to disable page caching | 1 day |
| PHPSESSID | Identifier for PHP session | Session |
| latest_news | Helps to keep notifications relevant by storing the latest news shown | 29 days |
| latest_news_flash | Helps to keep notifications relevant by storing the latest news shown | 29 days |
| tavex_recently_viewed_products | List of recently viewed products | 1 day |
| tavex_compare_amount | Number of items in product comparison view | 1 day |
Preference
| Cookie name | Cookie description | Cookie duration |
|---|---|---|
| chart-widget-tab-*-*-* | Remembers last chart options (i.e currency, time period, etc) | 29 days |
| archive_layout | Stores selected product layout on category pages | 1 day |
Marketing
| Cookie name | Cookie description | Cookie duration |
|---|---|---|
| cartstack.com-* | Used for tracking abandoned shopping carts | 1 year |
| _omappvp | Used by OptinMonster for determining new vs. returning visitors. Expires in 11 years | 11 years |
| _omappvs | Used by OptinMonster for determining when a new visitor becomes a returning visitor | Session |
| om* | Used by OptinMonster to track interactions with campaigns | Persistent |
Statistic
| Cookie name | Cookie description | Cookie duration |
|---|---|---|
| _ga | Used to distinguish users | 2 years |
| _gid | Used to distinguish users | 24 hours |
| _ga_* | Used to persist session state | 2 years |
| _gac_* | Contains campaign related information | 90 days |
| _gat_gtag_* | Used to throttle request rate | 1 minute |
| _fbc | Facebook advertisement cookie | 2 years |
| _fbp | Facebook cookie for distinguishing unique users | 2 years |

Silver Prices Over the Last 100 Years & the Impact of Inflation Adjustment
Published by Mattias Söderström in category Articles on 12.12.2024
Gold price (XAU-SEK)
40191,10 SEK/oz
+ 269,40 SEK
Silver price (XAG-SEK)
534,92 SEK/oz
+ 4,94 SEK

Innehållsförteckning / Table of Contents
Inflation adjustment can change how we perceive historical silver prices. We explain why 1980 seems so high compared to today and what inflation adjustment has to do with it.
The History of Silver Prices: Inflation-Adjusted or Not?
Looking at historical silver prices can be both fascinating and confusing. When viewing price charts that stretch far back in time, some years appear to have extreme peaks, while others seem barely noticeable. But what happens when prices are adjusted for inflation? Suddenly, the historical picture looks completely different!
Buy this silver coin at a great price today!

What Does Inflation Adjustment Mean?
Inflation adjustment involves recalculating historical prices into today’s monetary value to account for the effects of inflation over time. This helps compare prices from different time periods in a fairer way.
Example:
- Without Inflation Adjustment: A silver price of $50 per ounce in 1980 appears as $50 in a price chart.
- With Inflation Adjustment: The same $50 from 1980 could be equivalent to approximately $170 in today’s money, depending on the inflation rate.
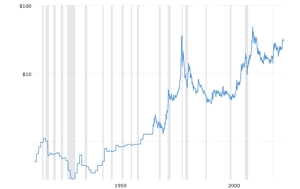
Silver price chart without inflation adjustment:
Silver price chart with inflation adjustment:
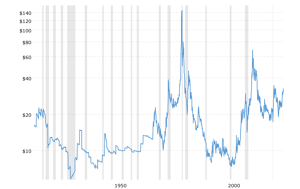
Image source: Macrotrends
Why Was the Silver Price So High in 1980?
In 1980, the silver price reached historic highs due to speculation and market manipulation by the famous Hunt brothers. The price surged to almost $50 per ounce, which was an incredible amount at the time.
However, without inflation adjustment, today’s price of around $25-30 per ounce may seem almost as high because charts don’t account for the reduced purchasing power of money since 1980.
Why Does 2011 Look Strongest Without Inflation Adjustment?
During the European debt crisis in 2011, silver prices rose to nearly $50 per ounce again, driven by economic uncertainty and increased investor interest. Since this occurred relatively recently, there’s no need for inflation adjustment to make the price appear high compared to historical data.
Why Does Today’s Silver Price Look Strong Compared to Previous Peaks?
Today’s silver price of around $25-30 per ounce may seem high when viewed at its nominal value. However, compared to 1980, when the inflation-adjusted price reached approximately $170, today’s price is far from its historical peak.
When Should You Use Inflation Adjustment?
To better understand historical price charts, consider the following:
- Use inflation adjustment to compare prices fairly over time.
- View prices without inflation adjustment to see the actual prices at a specific point in time.
- Historical peaks: 1980 appears highest when inflation-adjusted, while 2011 looks strongest without it.
Understanding how inflation adjustment works can make a big difference when analyzing historical commodity prices like silver.
Share your thoughts in the comments – and don’t forget to check out our current offers on gold and silver!
Gold price (XAU-SEK)
40191,10 SEK/oz
+ 269,40 SEK
Silver price (XAG-SEK)
534,92 SEK/oz
+ 4,94 SEK
Recommended articles


You might also like to read


Contact
Tavex AB Reg.nr.: 556671-1189 Smålandsgatan 9, 111 46 Stockholm, Sweden
E-mail: tavex@tavex.se
Tel. 08-678 20 30
Comments